Introduction
The concept of three-dimensional (3D) wiring is widely accepted among coronary interventionalists, especially among those who are enthusiastic about chronic total occlusion (CTO) percutaneous coronary intervention (PCI)123..Generally, during PCI it is important to view the target lesion from multiple directions without foreshortening. For 3D wiring, it is even more crucial to see the CTO segment from the correct angle, and, in addition, from 2 directions perpendicular to each other23 (Figure 1A). However, how to find the optimal fluoroscopic angulations for a given CTO segment has not been well established. The CT TrueView (Philips) is a software product which can display the optimal rotation and angulation of a C-arm of a designated coronary segment4. However, the software is not widely available because it is attached to Allura (Philips), a fluoroscopic system that only provides a single fluoroscopic plane angulation. We present a simple and practical approach for determining the optimal biplane fluoroscopic angulations. Our method utilises coronary computed tomography (CT) angiography (CCTA) and basic mathematical principles, without the need for specialised equipment or software.
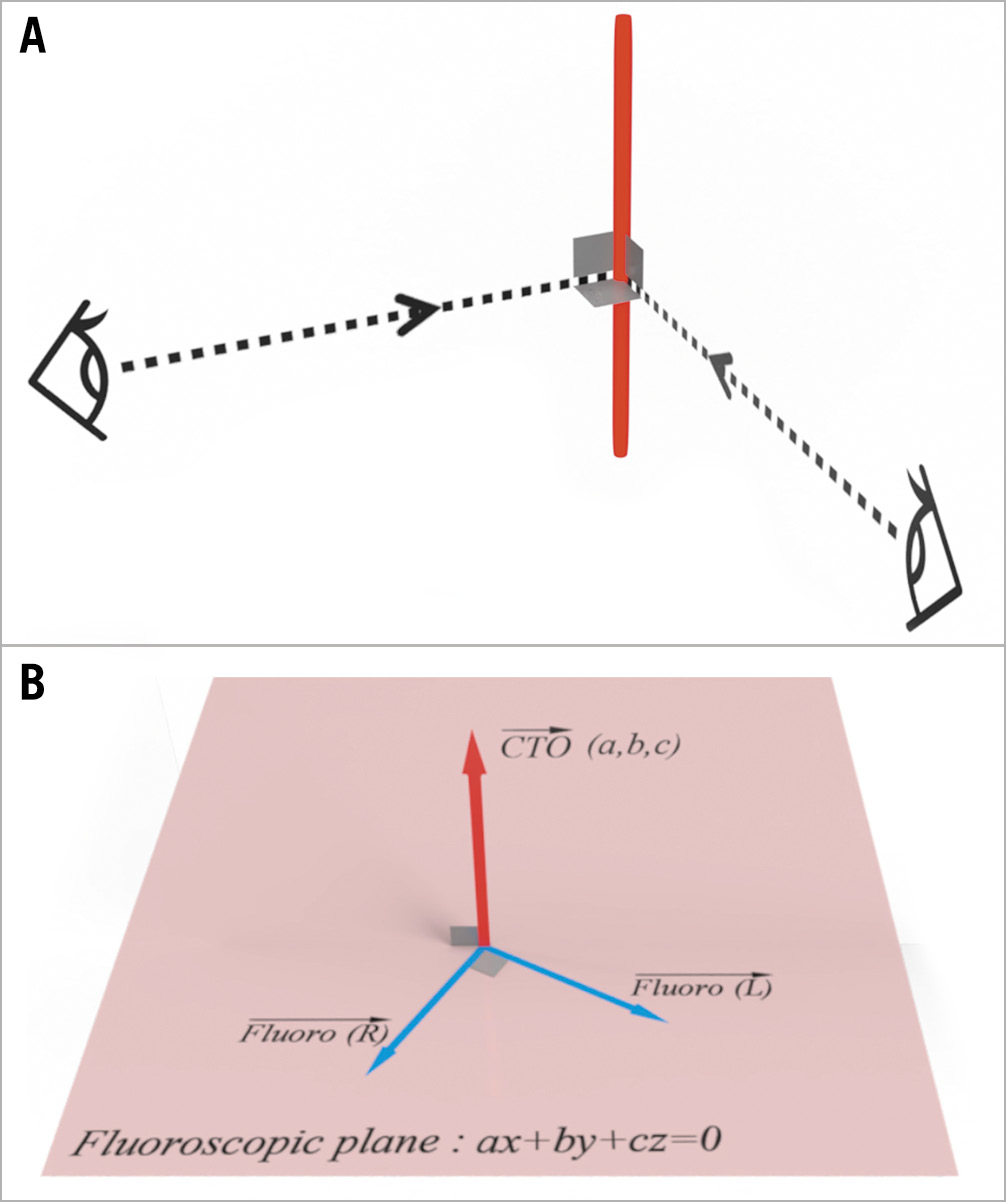
Figure 1. Triaxial orthogonality and the application of the equation of a plane. A) Viewing the CTO segment without foreshortening from 2 directions perpendicular to each other. B) Optimal fluoroscopic lines lie on the fluoroscopic plane. Red bold axis: CTO segment; red bold arrow: CTO vector; Fluoro (R): right fluoroscopic vector; Fluoro (L): left fluoroscopic vector. CTO: chronic total occlusion
Methods
Assuming a CTO segment to be a vector (CTO vector), optimal fluoroscopic lines should lie on the plane which is perpendicular to the vector (fluoroscopic plane) (Figure 1B). Fluoroscopic lines are depicted as vectors (fluoroscopic vectors). The objective of this article is to present a method for determining a CTO vector and, subsequently, identifying the fluoroscopic vectors. These vectors are then translated into a combination of optimal right and left fluoroscopic angulations. To achieve this goal, we will employ basic mathematical concepts such as trigonometric functions, inner products of vectors, and equations of a plane, in addition to maximum intensity projection (MIP) images of coronary CT angiography.
This study was exempt from the requirements of the Institutional Review Board at Kitsuki City Yamaga Hospital because it contains no patient-identifiable information.
Basics of trigonometric functions and equation of a plane
For two vectors making an angle θ, the formula of the inner product describes the relationship between the inner product, their lengths, and the angle between them (Figure 2A).
In the specific case where the 2 vectors make a right angle, the inner product equals zero, as the cosine of 90 degrees is 0 (Figure 2B).
In the application on a plane, the relationship between a vector (a, b, c) perpendicular to a plane and an arbitrary position vector (x, y, z) on this plane is represented as ax + by + cz = 0 (equation of a plane) (Figure 1B). The vector (a, b, c) is referred to as the normal vector of the plane. Assuming the normal vector to be a CTO vector, the fluoroscopic vectors, shown here as Fluoro (R) and Fluoro (L), would be located on this plane.
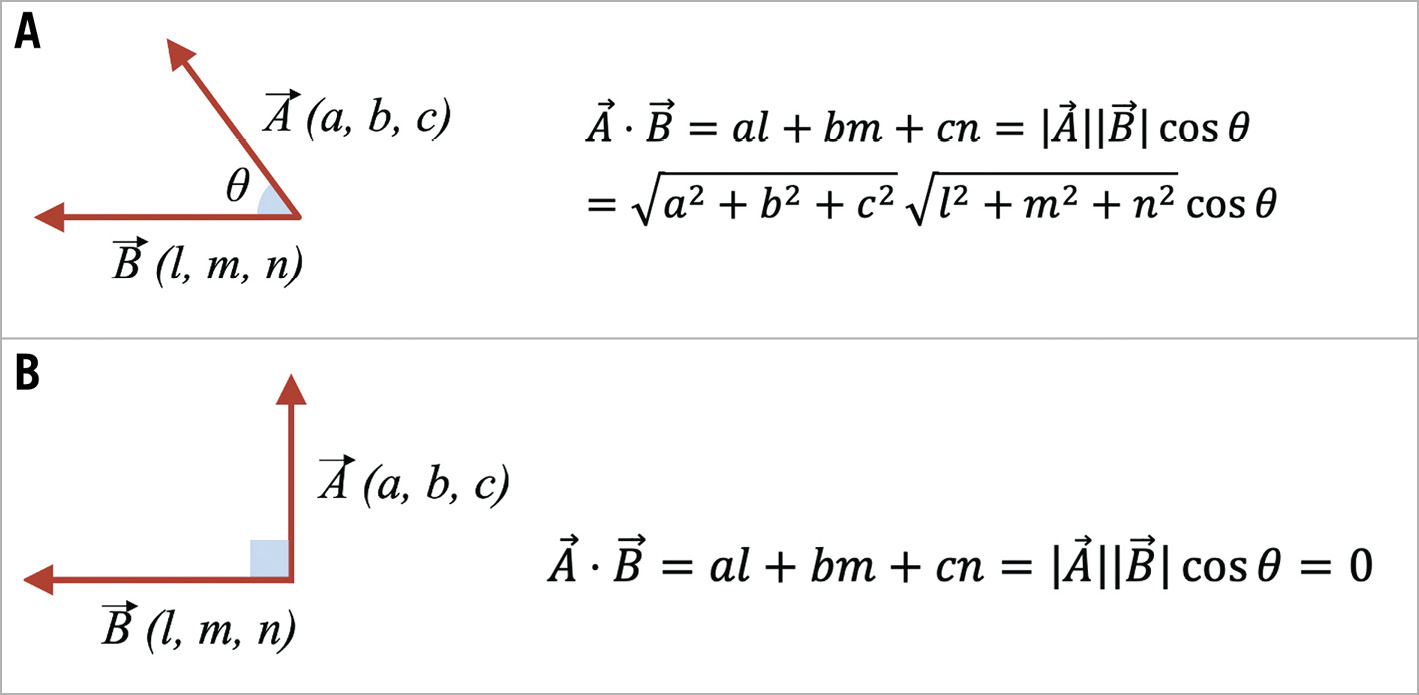
Figure 2. Inner product of vectors. Inner product of vectors (A) and a specific case of 2 vectors making a right angle (B)
Derivation of CTO vector
In a virtual XYZ space overlaid on a patient’s body, we set reference X-, Y-, Z-axes and reference coronal, sagittal and transverse planes (Figure 3). The CTO vector is represented by a bold red arrow, with its x, y, and z components depicted as fine red lines. Drawing its projection vectors onto the reference planes (red dotted arrows) and measuring the angle with the reference axis, the CTO vector can be expressed using trigonometric functions. In this paper, vectors are represented by the simplest trigonometric functions, as only the direction of the vector is relevant for the purposes of this study and not its magnitude.
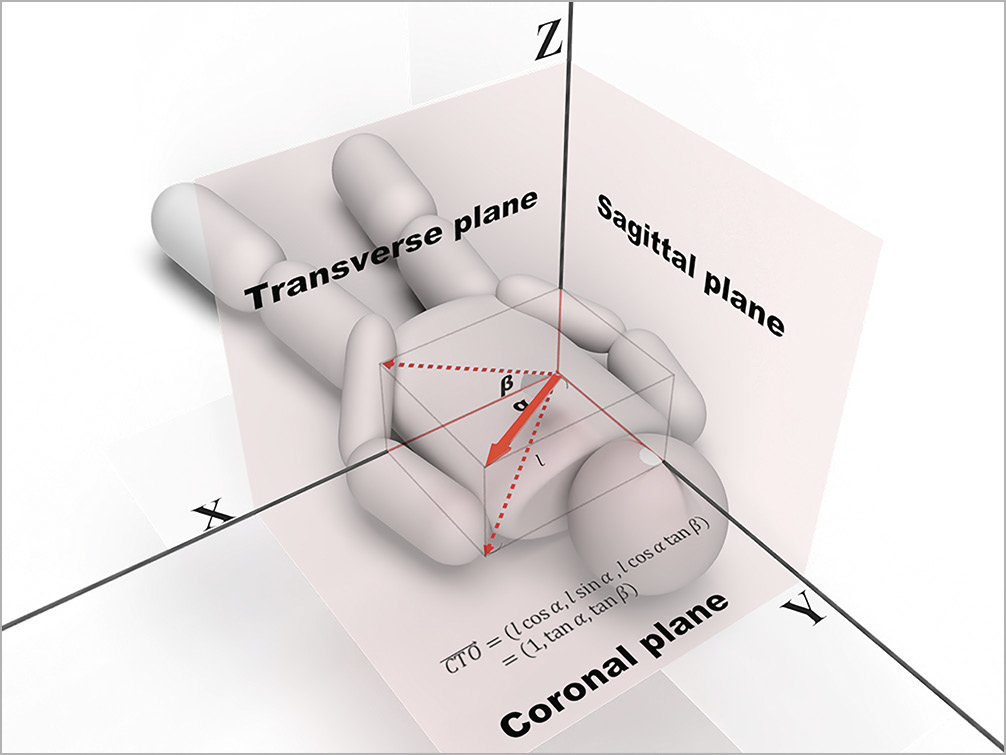
Figure 3. CTO vector in a virtual XYZ space. The CTO vector is shown as a red bold arrow, its x, y and z components as red fine lines, and its projection vector onto the reference planes as red dotted arrows. The CTO vector is noted as the simplest trigonometric functions. CTO: chronic total occlusion
Results
We will apply this to a patient with a mid-left circumflex (LCx) CTO (Figure 4), using the image viewer to display 3 of the basic cross-sections of a CCTA (Figure 5A). With the universally prevalent image viewers, you can set the thickness of slab MIP. Apply a 9 mm thick slab, in this case on the coronal plane, and search for an adequate slab that contains the whole length of the CTO. For this case, calcifications at the origin, middle, and end of the CTO help us orient the location of the CTO (Figure 5B). These allow us to draw the projection line of the CTO onto the coronal plane, and the angle with the Y-axis measures 23.6 degrees. Similarly, by applying a 8 mm thick slab, drawing the projection line onto the sagittal plane and measuring the angle with the Y-axis, we derived 25.6 degrees (Figure 5C). Using trigonometric functions, the CTO vector in the left anterior oblique (LAO) cranial direction was determined as (0.437, 1.000, 0.479) (Figure 6A, Supplementary Figure 1).
The thickness of the slab required to project the entire length of the CTO segment onto the coronal and sagittal planes is denoted as t1 and t2, respectively.
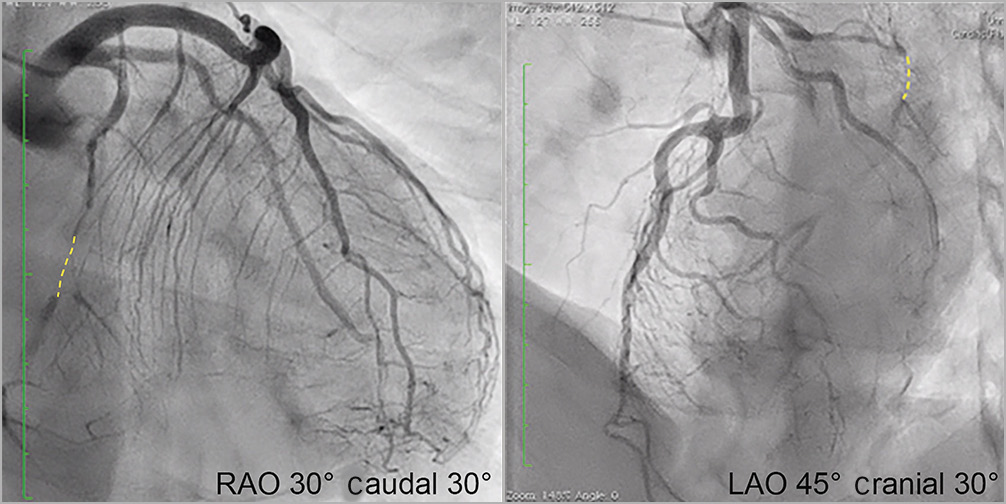
Figure 4. A case of mid-LCx CTO. Yellow dotted lines represent the CTO segment of the mid-LCx. CTO: chronic total occlusion; LCx: left circumflex
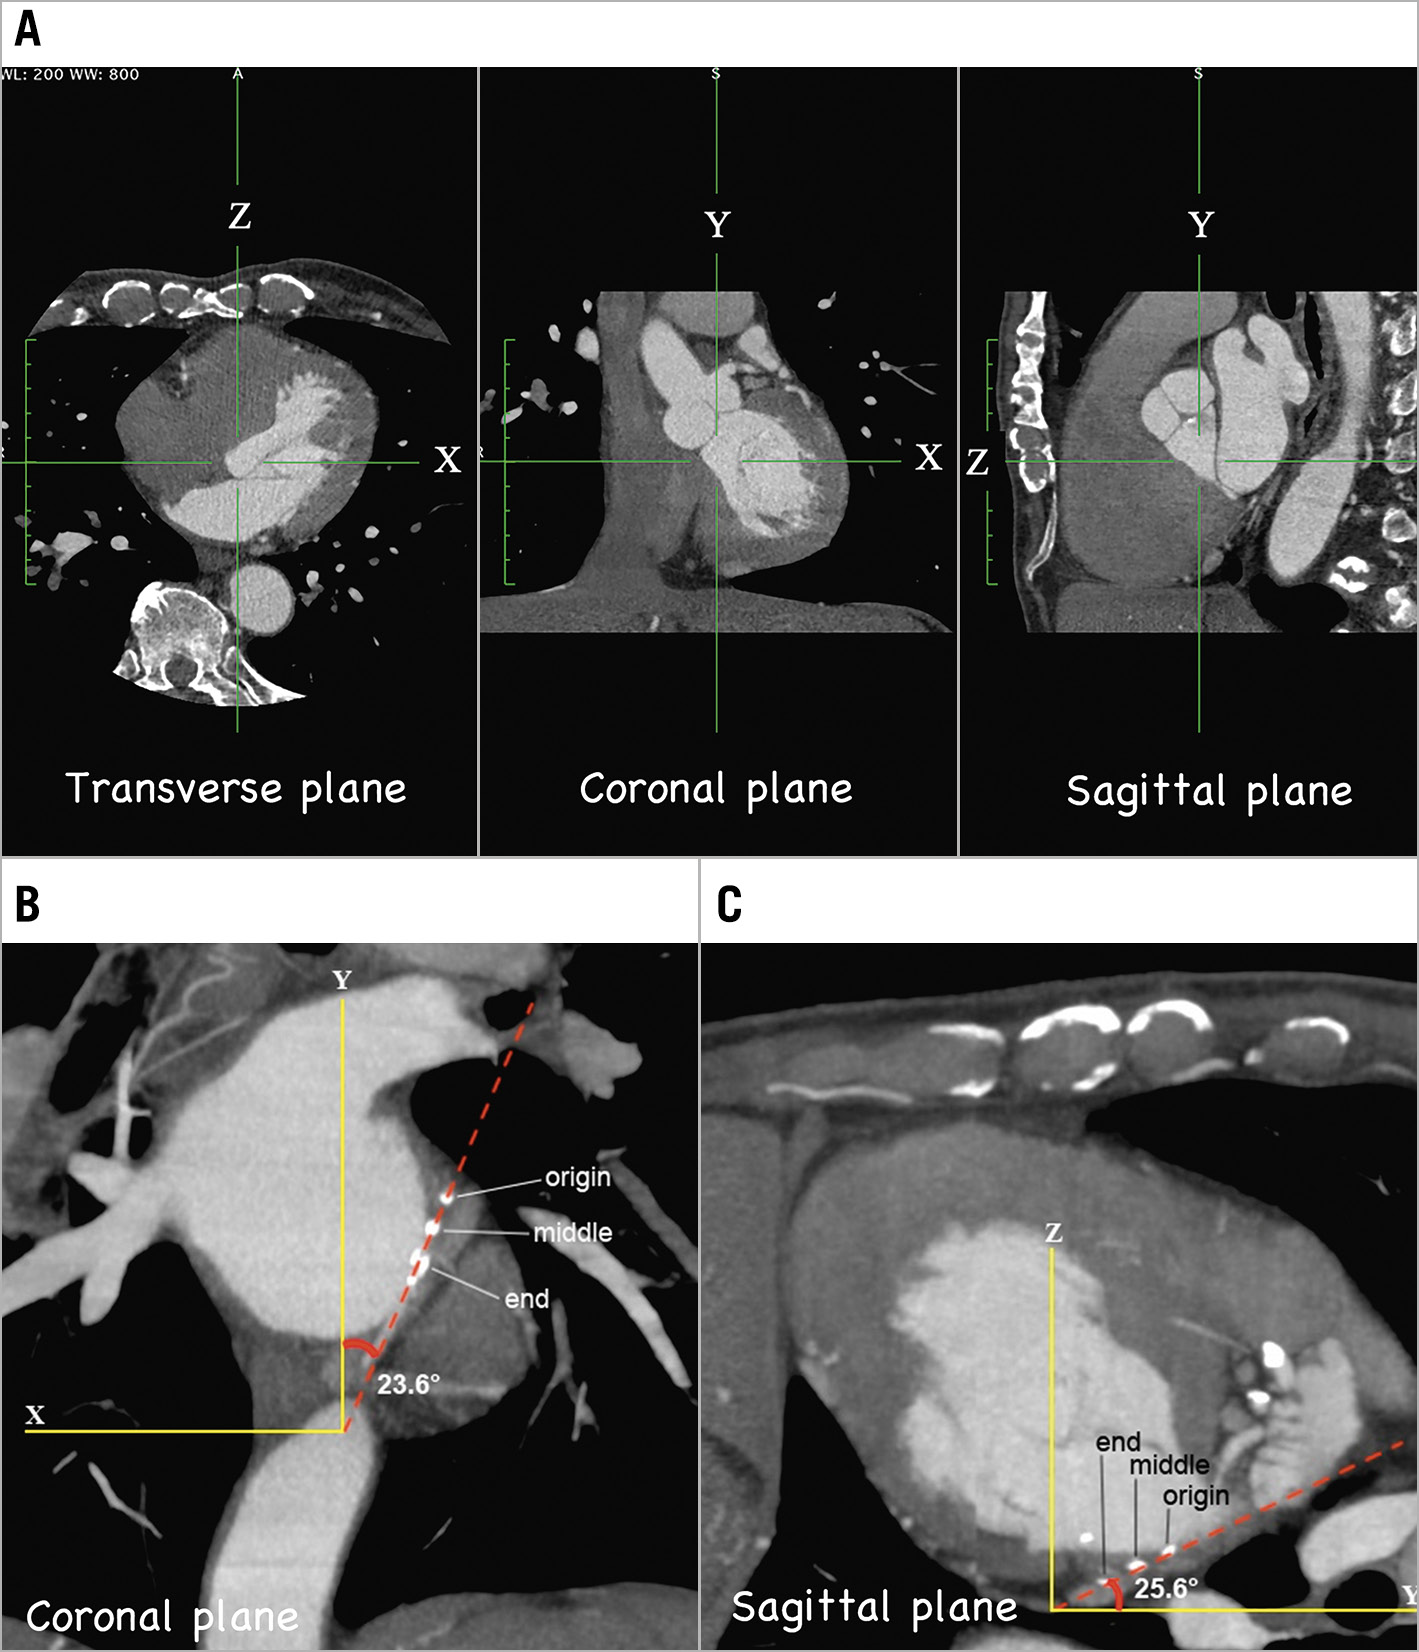
Figure 5. Derivation of CTO vectors from coronary CT angiography. A) Basic cross-sections of coronary CT angiography. B) Slab MIP image on coronal plane. A 9 mm-thick slab allows the operator to draw the projection line of the whole length of the CTO onto the coronal plane (red dotted line) and to measure the angle with the Y-axis. C) A slab MIP image on the sagittal plane. An 8 mm-thick slab is applied to draw the projection line onto the sagittal plane (red dotted line) and to measure the angle with the Y-axis. CT: computed tomography; CTO: chronic total occlusion; MIP: maximum intensity projection
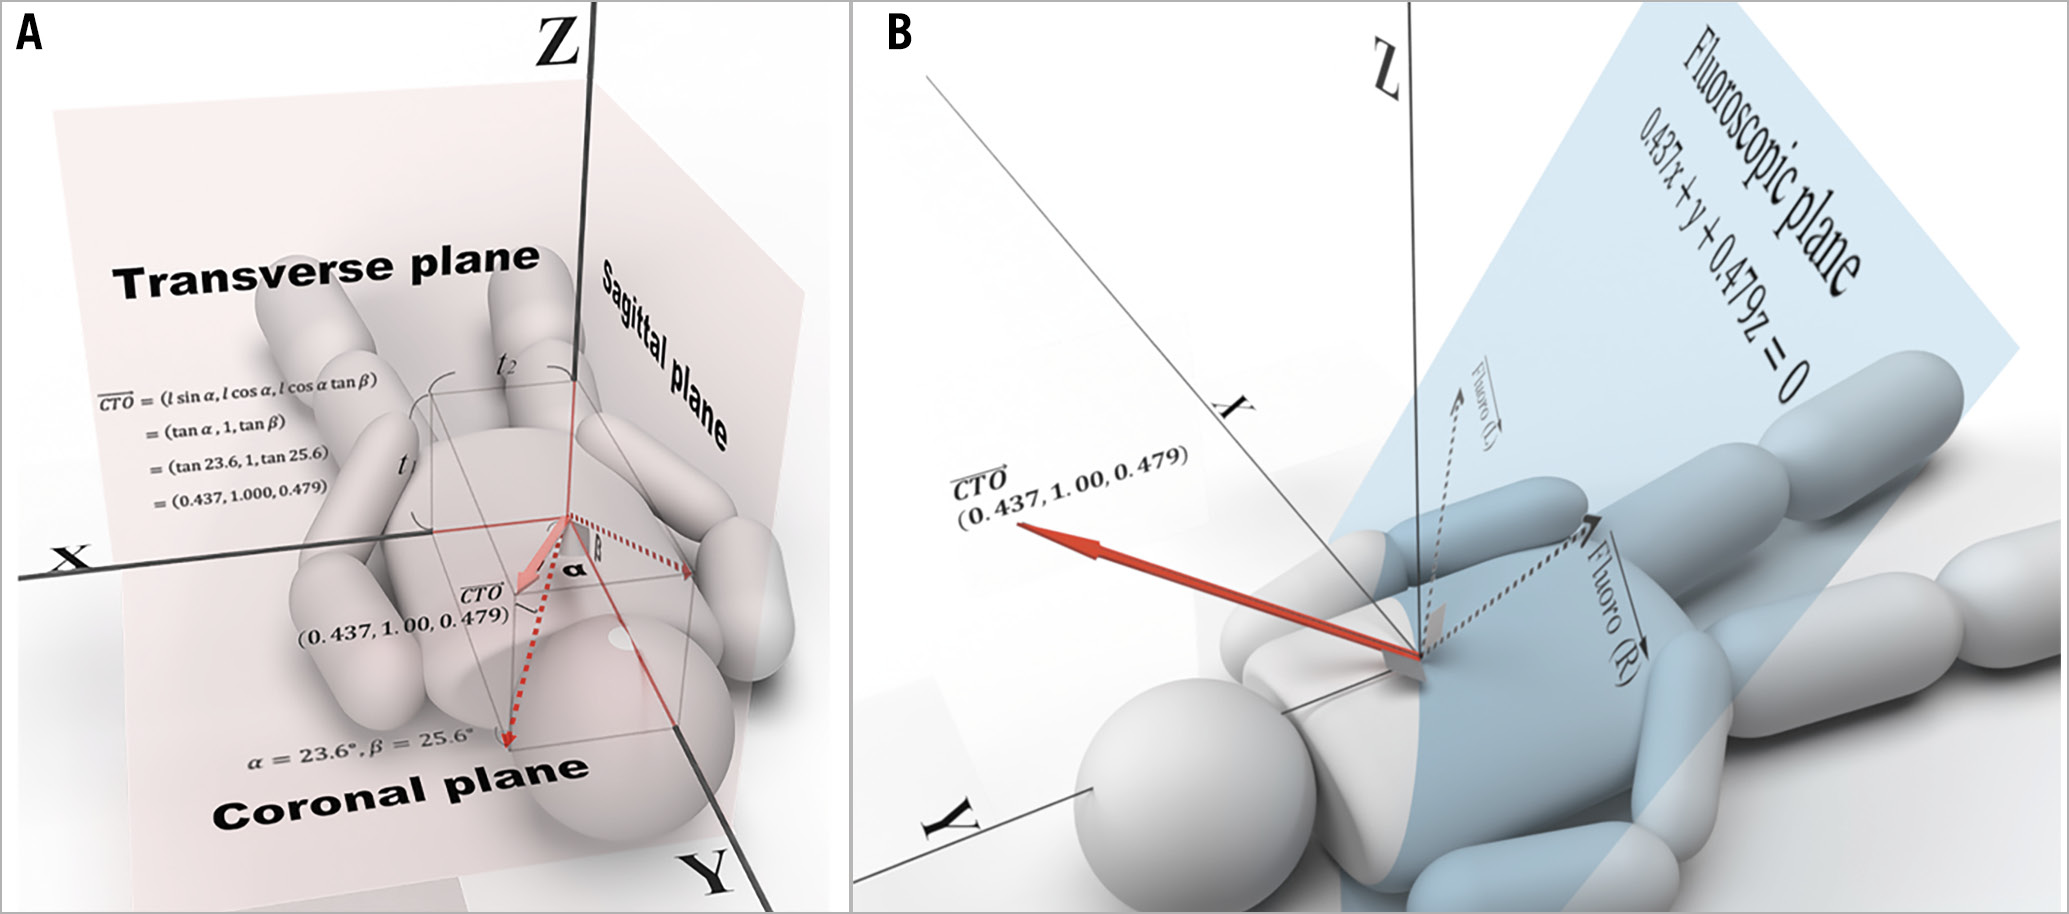
Figure 6. Determination of the CTO vector of the mid-LCx and derivation of the fluoroscopic plane. A) Determination of the CTO vector from angles measured in Figure 5 and trigonometric functions. t1 is the thickness of slab needed for the projection of the whole length of the CTO onto the coronal plane; t2 is the thickness of slab needed for the projection of the whole length of the CTO onto the sagittal plane. B) The fluoroscopic plane is depicted in the virtual XYZ space along with the CTO vector (red bold arrow) as its normal vector. The combination of optimal fluoroscopic vectors lie on this plane (black dotted arrows, Fluoro [R]: right fluoroscopic vector and Fluoro [L]: left fluoroscopic vector). CTO: chronic total occlusion, LCx: left circumflex artery
Derivation of fluoroscopic vectors and angulations
Using the equation of a plane, a plane perpendicular to the CTO vector is represented as:
0.437x + y + 0.479z = 0 (equation of a fluoroscopic plane)
Both the right and left fluoroscopic vectors lie on it (Figure 6B). There are numerous possibilities, so from a viewpoint of practical utility, we set the right anterior oblique (RAO) angle at 30 degrees for the right fluoroscopic vector. Here, we examined how to create fluoroscopic angulations, such as LAO 45° caudal 30°, which involves a series of rotations performed by the C-arm5. The C-arm first rotates clockwise on the transverse plane by 45 degrees (Figure 7A) and then rotates caudally by 30 degrees on the left 45-degree plane (Figure 7B). Note that for any vector on the left 45-degree plane, regardless of its cranial or caudal angulation, the ratio of its x and z components is always 1:1. When RAO 30° is applied, similarly the x and z components of the right fluoroscopic vector are automatically set as −1 and â3, respectively. By assigning these values to the equation of the fluoroscopic plane, the y component can be calculated, and the right fluoroscopic vector was determined, as shown in Supplementary Figure 2, and Figure 8A.
Next, the method for converting a vector into a fluoroscopic angulation is described (Figure 8A). Calculating the angle between the right fluoroscopic vector (the blue solid vector) and its projection vector onto the transverse plane (the blue dotted vector) according to the formula for an inner product, the angle is 11.1 degrees (Figure 8B). The right fluoroscopic angulation is finally determined as (RAO 30° caudal 11°).
Because the CTO, the right and left fluoroscopic vectors are orthogonal to each other, the left fluoroscopic vector is calculated as (2.32, â1.49, 1.00) by solving the system of the equations in Supplementary Figure 3.
As mentioned for the right fluoroscopic vector, the LAO angle is determined by the x and z components of the fluoroscopic vector. That is, the angle giving a tangent of 2.32/1.00 is 66.7 degrees (Figure 8B). The angle between the left fluoroscopic vector and its projection onto the transverse plane (2.32, 0, 1.00), according to the formula of inner product, is determined to be 30.6 degrees. Now we have identified one of the combinations of optimal fluoroscopic angulations: (RAO 30° caudal 11°) and (LAO 67° caudal 31°).
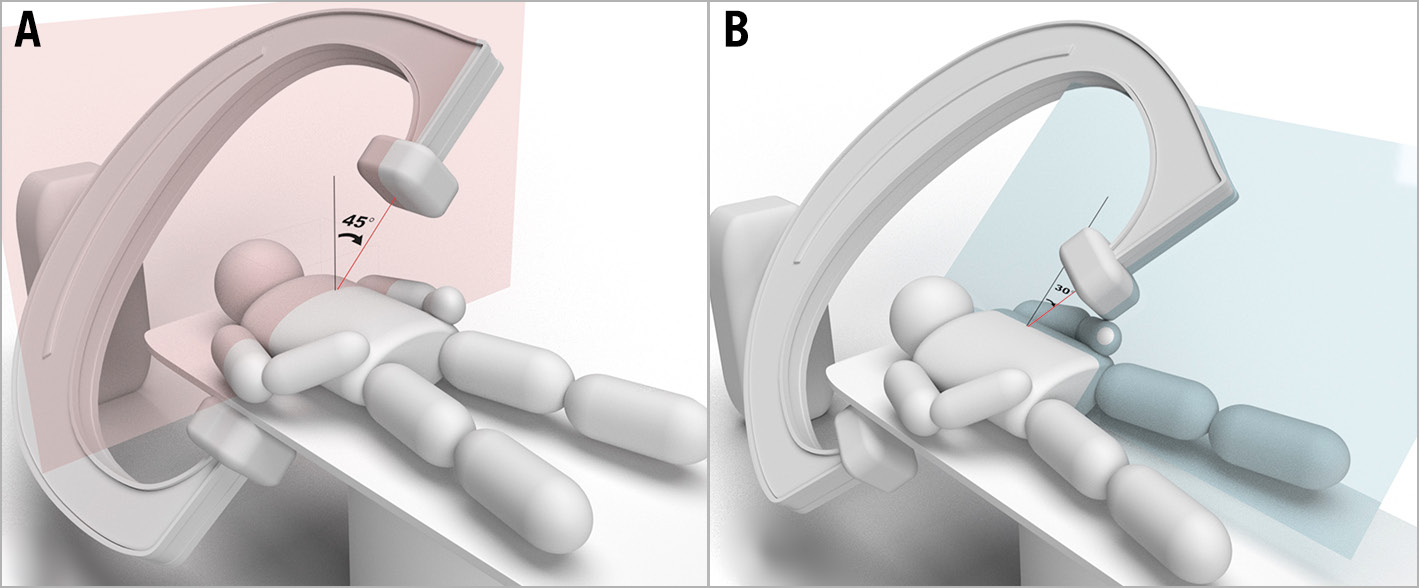
Figure 7. How to create LAO 45° caudal 30°. A) Clockwise rotation of the C-arm on the transverse plane by 45 degrees, followed by (B) rotating caudally on the left 45-degree plane by 30 degrees. LAO: left anterior oblique
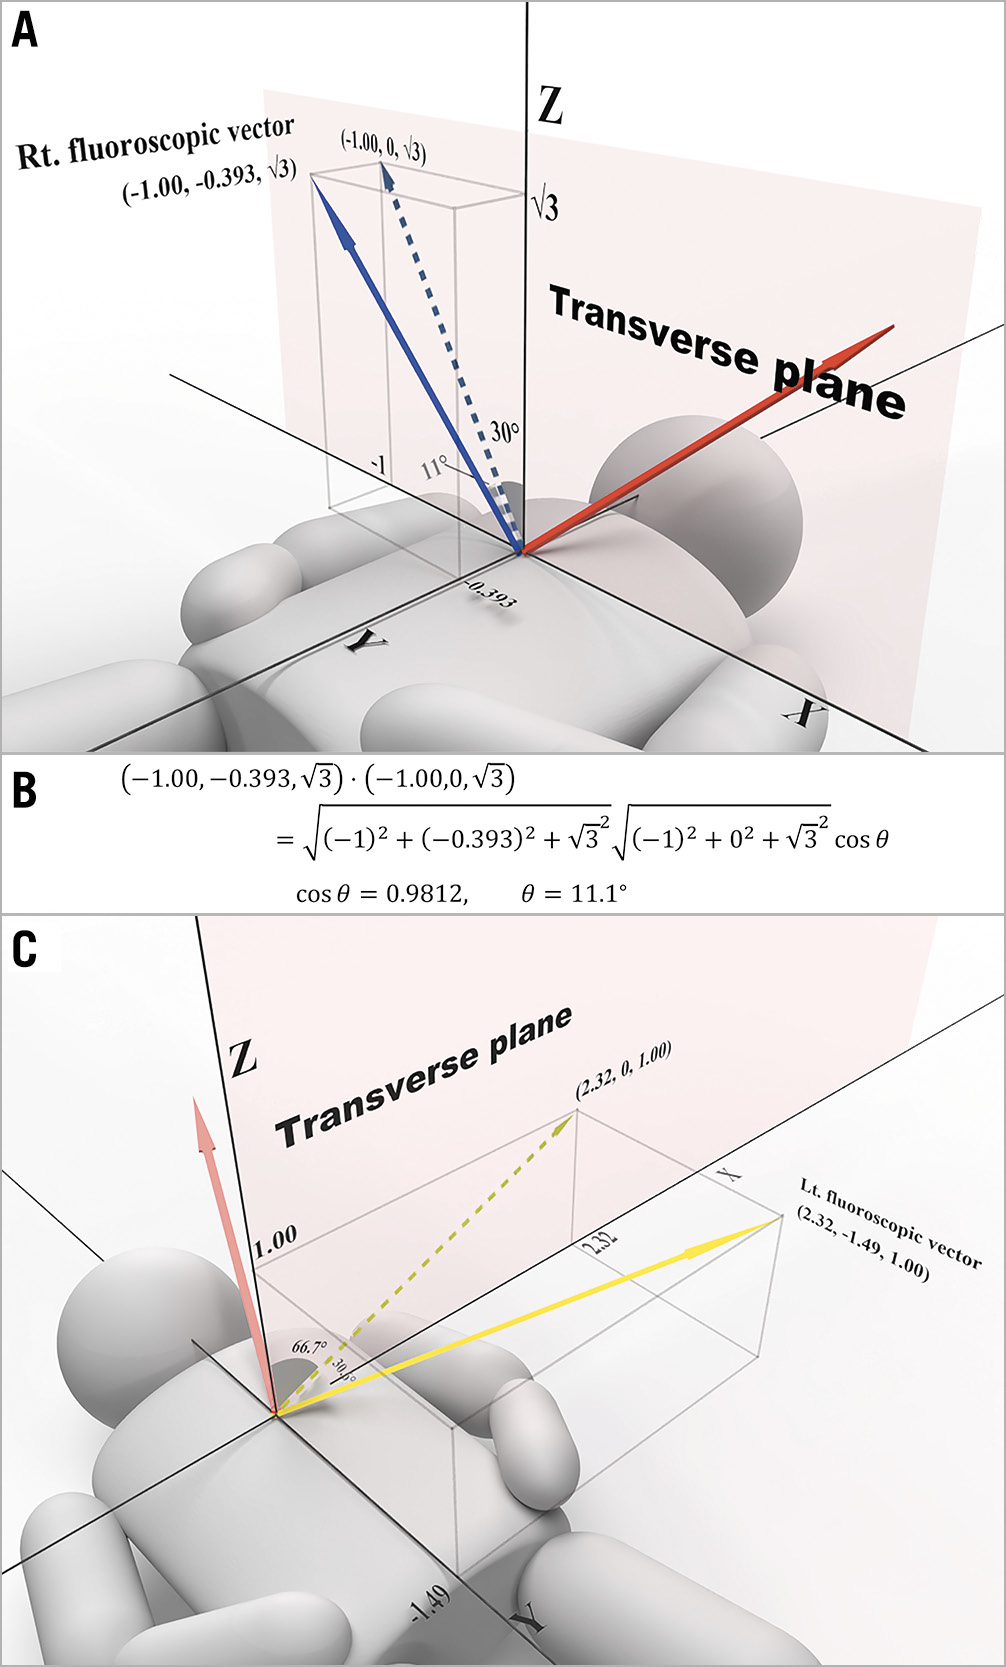
Figure 8. Right and left fluoroscopic vectors and angulations. A) Right fluoroscopic vector and angulation. The caudal angulation is the angle between the right fluoroscopic vector (blue solid arrow) and its projection vector onto the transverse plane (blue dotted arrow). B) The caudal angulation can be calculated from the formula of the inner product. C) Left fluoroscopic vector and angulation. The left fluoroscopic angulation can be derived just as in the right fluoroscopic angulation. Note that the LAO angle is determined only by the x and z components of the fluoroscopic vector. Red bold arrow: CTO vector; yellow solid arrow: left fluoroscopic vector; yellow dotted arrow: projection vector onto the transverse plane of the left fluoroscopic vector. CTO: chronic total occlusion, LAO: left anterior oblique
Application to another CTO case
Another case of PCI for mid-circumflex CTO, in which this method was actually applied, is shown. Using slab MIP of CCTA and the calculator, the combination of practical optimal fluoroscopic angulations was calculated as (RAO 45° cranial 8°) and (LAO 46° cranial 8°) (Supplementary Figure 4, Supplementary Figure 5, Supplementary Table 1). We started the procedure with a bilateral approach. Bilateral tip injection allowed good visualisation of the CTO at LAO 46° cranial 8° but the visualisation at RAO 45° cranial 8° was poor because of the overlap of the guide and prosthesis (Supplementary Figure 6). In order to avoid these obstacles, alternative angulations (RAO 11° cranial 23°) were adopted for the right fluoroscopic angulation (Supplementary Figure 7). We used another calculator here (Supplementary Table 2), by which the angle between the 2 vectors and the shortening rate can be obtained. By entering the CTO vector in advance and entering (RAO 11° cranial 23°) in the fluoroscopic angle cell, the angle of 56.5 degrees is derived. Since 1 â sin 56.5° is equal to 0.166, the shortening rate of the lesion when this fluoroscopic angulation is adopted is 16.6%. Of course, for the ideal fluoroscopic angulation, this angle would be 90 degrees, so the foreshortening would be 0%. The second row of the table shows the angle between the 2 adopted fluoroscopic vectors. This calculator can be used in the cath lab during the procedure. For the right fluoroscopic angulation, an alternative was used to proceed with the procedure, a tapered guidewire passed antegradely through the lesion (Supplementary Figure 8), and finally, a drug-eluting stent was implanted (Supplementary Figure 9).
Development of the calculator
Because calculating complex formulas at each CTO vector requires so much energy, we developed a calculator using spreadsheet software (Table 1). Assigning the x, y and z components of a CTO vector, the answers for designated RAO angles can be calculated automatically. It will display combinations of the right and left fluoroscopic angulations in 5-degree increments in the range from RAO 0 to 60 degrees for practical use. Recalculations are done to confirm if these complex calculations are true: the inner product of any 2 of the 3 vectors should equal 0 and there should be no discrepancy between fluoroscopic vectors derived from a CTO vector and those inversely translated from fluoroscopic angulations (independently calculated from the original formulas) (Table 2).
Table 1. Calculator for right and left fluoroscopic angulations.
| RAO | CTO vector | Right fluoroscopic vector | Left fluoroscopic vector | Right fluoroscopic angulation | Left fluoroscopic angulation | ||||||||
|---|---|---|---|---|---|---|---|---|---|---|---|---|---|
| x | y | z | x | y | z | x | y | z | RAO | Cranial | LAO | Cranial | |
| R0 | 0.437 | 1.000 | 0.479 | 0.000 | –0.479 | 1.000 | –5.874 | 2.087 | 1.000 | 0.0° | –25.6° | –80.3° | 19.3° |
| R5 | 0.437 | 1.000 | 0.479 | –0.087 | –0.439 | 0.996 | –11.521 | 4.554 | 1.000 | 5.0° | –23.7° | –85.0° | 21.5° |
| R10 | 0.437 | 1.000 | 0.479 | –0.174 | –0.396 | 0.985 | 1,805.611 | –789.331 | 1.000 | 10.0° | –21.6° | 90.0° | –23.6° |
| R15 | 0.437 | 1.000 | 0.479 | –0.259 | –0.350 | 0.966 | 10.690 | –5.150 | 1.000 | 15.0° | –19.3° | 84.7° | –25.6° |
| R20 | 0.437 | 1.000 | 0.479 | –0.342 | –0.301 | 0.940 | 5.146 | –2.727 | 1.000 | 20.0° | –16.7° | 79.0° | –27.5° |
| R25 | 0.437 | 1.000 | 0.479 | –0.423 | –0.250 | 0.906 | 3.272 | –1.908 | 1.000 | 25.0° | –14.0° | 73.0° | –29.2° |
| R30 | 0.437 | 1.000 | 0.479 | –0.500 | –0.196 | 0.866 | 2.318 | –1.492 | 1.000 | 30.0° | –11.1° | 66.7° | –30.6° |
| R35 | 0.437 | 1.000 | 0.479 | –0.574 | –0.142 | 0.819 | 1.734 | –1.237 | 1.000 | 35.0° | –8.1° | 60.0° | –31.7° |
| R40 | 0.437 | 1.000 | 0.479 | –0.643 | –0.086 | 0.766 | 1.334 | –1.062 | 1.000 | 40.0° | –4.9° | 53.1° | –32.5° |
| R45 | 0.437 | 1.000 | 0.479 | –0.707 | –0.030 | 0.707 | 1.039 | –0.933 | 1.000 | 45.0° | –1.7° | 46.1° | –32.9° |
| R50 | 0.437 | 1.000 | 0.479 | –0.766 | 0.027 | 0.643 | 0.810 | –0.833 | 1.000 | 50.0° | 1.5° | 39.0° | –32.9° |
| R55 | 0.437 | 1.000 | 0.479 | –0.819 | 0.083 | 0.574 | 0.624 | –0.752 | 1.000 | 55.0° | 4.7° | 32.0° | –32.5° |
| R60 | 0.437 | 1.000 | 0.479 | –0.866 | 0.139 | 0.500 | 0.468 | –0.683 | 1.000 | 60.0° | 7.9° | 25.1° | –31.8° |
| Assigning the x, y and z components of a CTO vector (boxes with yellow figures), fluoroscopic vectors and fluoroscopic angulations for a designated RAO angle are automatically calculated. R0~60 represent RAO angles. Negative values in cranial boxes demonstrate “caudal” angles. LAO: left anterior oblique; RAO: right anterior oblique | |||||||||||||
Table 2. Recalculation table.
| Recalculation | ||||||||||||
|---|---|---|---|---|---|---|---|---|---|---|---|---|
| Recalculation | ||||||||||||
| Right fluoroscopic angulation | Left fluoroscopic angulation | Inner product of 2 of the 3 vectors | Right fluoroscopic vector | Left fluoroscopic vector | ||||||||
| RAO | Cranial | LAO | Cranial | CTO & Fluoro (R) | CTO & Fluoro (L) | Fluoro (R)&Fluoro (L) | x | y | z | x | y | z |
| 0.0° | –25.6° | –80.3° | 19.3° | 0.00 | 0.00 | 0.00 | 0.000 | –0.479 | 1.000 | –5.874 | 2.087 | 1.000 |
| 5.0° | –23.7° | –85.0° | 21.5° | 0.00 | 0.00 | 0.00 | –0.087 | –0.439 | 0.996 | –11.521 | 4.554 | 1.000 |
| 10.0° | –21.6° | 90.0° | –23.6° | 0.00 | 0.00 | 0.00 | –0.174 | –0.396 | 0.985 | 1,805.611 | –789.331 | 1.000 |
| 15.0° | –19.3° | 84.7° | –25.6° | 0.00 | 0.00 | 0.00 | –0.259 | –0.350 | 0.966 | 10.690 | –5.150 | 1.000 |
| 20.0° | –16.7° | 79.0° | –27.5° | 0.00 | 0.00 | 0.00 | –0.342 | –0.301 | 0.940 | 5.146 | –2.727 | 1.000 |
| 25.0° | –14.0° | 73.0° | –29.2° | 0.00 | 0.00 | 0.00 | –0.423 | –0.250 | 0.906 | 3.272 | –1.908 | 1.000 |
| 30.0° | –11.1° | 66.7° | –30.6° | 0.00 | 0.00 | 0.00 | –0.500 | –0.196 | 0.866 | 2.318 | –1.492 | 1.000 |
| 35.0° | –8.1° | 60.0° | –31.7° | 0.00 | 0.00 | 0.00 | –0.574 | –0.142 | 0.819 | 1.734 | –1.237 | 1.000 |
| 40.0° | –4.9° | 53.1° | –32.5° | 0.00 | 0.00 | 0.00 | –0.643 | –0.086 | 0.766 | 1.334 | –1.062 | 1.000 |
| 45.0° | –1.7° | 46.1° | –32.9° | 0.00 | 0.00 | 0.00 | –0.707 | –0.030 | 0.707 | 1.039 | –0.933 | 1.000 |
| 50.0° | 1.5° | 39.0° | –32.9° | 0.00 | 0.00 | 0.00 | –0.766 | 0.027 | 0.643 | 0.810 | –0.833 | 1.000 |
| 55.0° | 4.7° | 32.0° | –32.5° | 0.00 | 0.00 | 0.00 | –0.819 | 0.083 | 0.574 | 0.624 | –0.752 | 1.000 |
| 60.0° | 7.9° | 25.1° | –31.8° | 0.00 | 0.00 | 0.00 | –0.866 | 0.139 | 0.500 | 0.468 | –0.683 | 1.000 |
| Right and left fluoroscopic vectors demonstrate right and left fluoroscopic vectors calculated inversely from the fluoroscopic angulations and independently of the original formulas. CTO: chronic total occlusion vector; Fluoro (L): left fluoroscopic vector; Fluoro (R): right fluoroscopic vector; LAO: left anterior oblique; RAO: right anterior oblique | ||||||||||||
Discussion
Minimising shortening is crucial not only for CTO but also for any target lesion. When biplane fluoroscopy, which provides orthogonal views as shown in Figure 1A, is available, the guidewire tip behaviour can be accurately visualised, potentially enhancing procedural success and safety. However, identifying optimal biplane fluoroscopic angulations is challenging. Here, we propose a method based on the equation of a plane. By adopting the CTO vector as the plane’s normal vector, the fluoroscopic lines will lie on this plane. We further utilised CCTA’s slab MIP images to vectorise the CTO lesion, which can be achieved using standard image viewers without specialised software. With the use of trigonometric functions and inner product formulas, fluoroscopic vectors can be translated into multiple optimal fluoroscopic angulations. It is important to note that due to different reference planes and axes for each CTO lesion, careful attention must be paid to the CTO vector’s direction while calculating the components to avoid disorientation.
Images of CCTA are reconstructed from the data acquired mainly during end systole or mid-diastole6789. In case of excessive excursion during the cardiac cycle, as is often seen in the midportion of right coronary arteries, optimal fluoroscopic angulations in other cardiac phases might differ significantly from what we propose here. Nonetheless, the cardiac motion is minimal, and accordingly, it is easy to observe a guidewire during these periods. Thus, it is reasonable to employ images from CCTA to derive optimal fluoroscopic angulations. PCI operators need to be aware of the timing of acquisition shown on the summary of the relevant coronary CT angiography.
Although it is possible to calculate optimal fluoroscopic angulations for any CTO vectors, they sometimes do not work in practice. For example, in case of a CTO vector parallel to the Z (anteroposterior)-axis, fluoroscopic beams lie on the coronal plane, which would not be clinically applicable because of the inability to set the X-ray tube and the detector in place or an unacceptable increase in X-ray dose (Figure 9). In such cases or the actual application to PCI mentioned above, the calculator shown in Supplementary Table 2 can be used to find the angle between the adopted “realistic” fluoroscopic vector and the CTO segment as well as the shortening rate. In this way, even if the ideal fluoroscopic angulations (where the 3 vectors are orthogonal) cannot be used, it is important to proceed with the procedure while being conscious of how obliquely the lesion is viewed and how much the lesion is shortened.
The spreadsheet software developed in this study is capable of displaying optimal fluoroscopic angulations by inputting the x, y and z components of a CTO vector. However, when the CTO vector has a y component of 0 (lying on the transverse plane), the software fails to output the correct solution due to a denominator of 0 in the formula. In such cases, assigning a very small value to the y component could yield a nearly correct solution.
This method is not applicable to bent sections, including the acute margin of the right coronary arteries. However, the optimal fluoroscopic angulations for the proximal and distal straight-line portions adjacent to bent sections, if any, can be separately calculated.
Although the methodology is relatively straightforward and does not necessitate any specialised tools or applications, the derivation of the CTO vector from the slab MIP may be deemed complex. To streamline this aspect, the development of an application capable of automatically computing the optimal angles by drawing CTO lines on the angiographic view of CCTA or coronary angiography would be highly advantageous. Such a tool would simplify the process and render it more accessible to a wider range of PCI operators, ultimately contributing to the advancement of the field.
Even when using biplane fluoroscopy, there may still be areas where the guidewire appears to be inside the vessel despite actually deviating outside (dead angle; blue dotted areas in Figure 10A). This dead angle is minimised when sin θ equals 1, which occurs when the 2 fluoroscopic lines are orthogonal to each other (Figure 10B). Therefore, by minimising the dead angle that cannot be completely resolved even with biplane fluoroscopy, this method may reduce the risk of vessel perforation and improve the safety of CTO PCI.
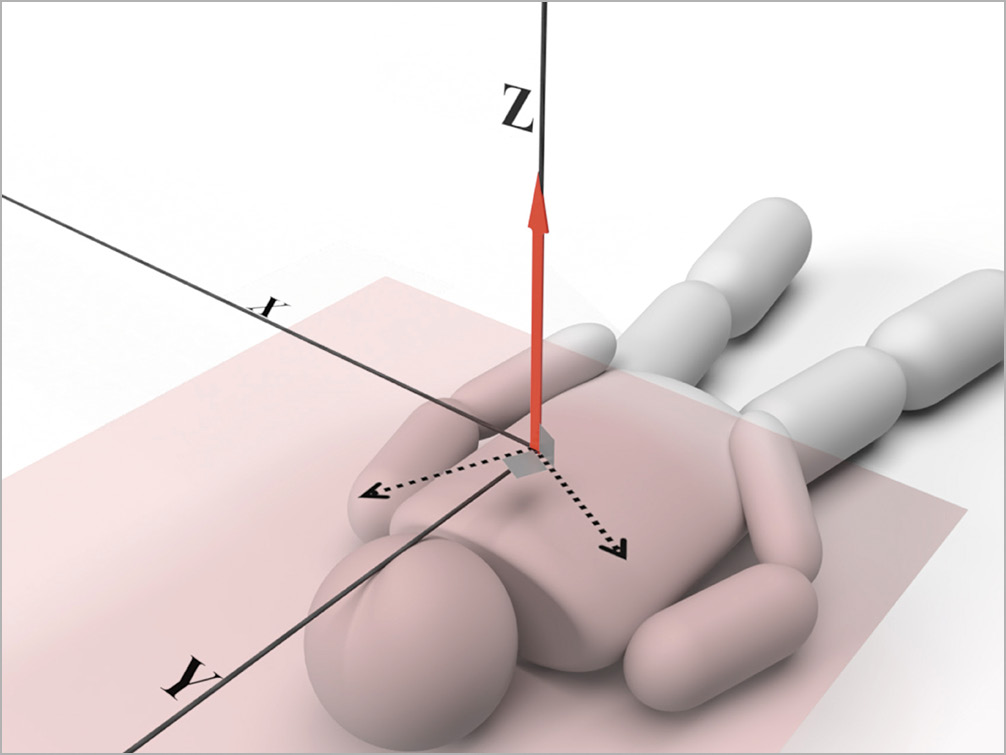
Figure 9. CTO vector parallel to the Z-axis. It is virtually impossible to continue a PCI procedure with a fluoroscopic vector on the coronal plane. Red bold arrow: CTO vector; black dotted arrows: fluoroscopic vectors. CTO: chronic total occlusion; PCI: percutaneous coronary intervention
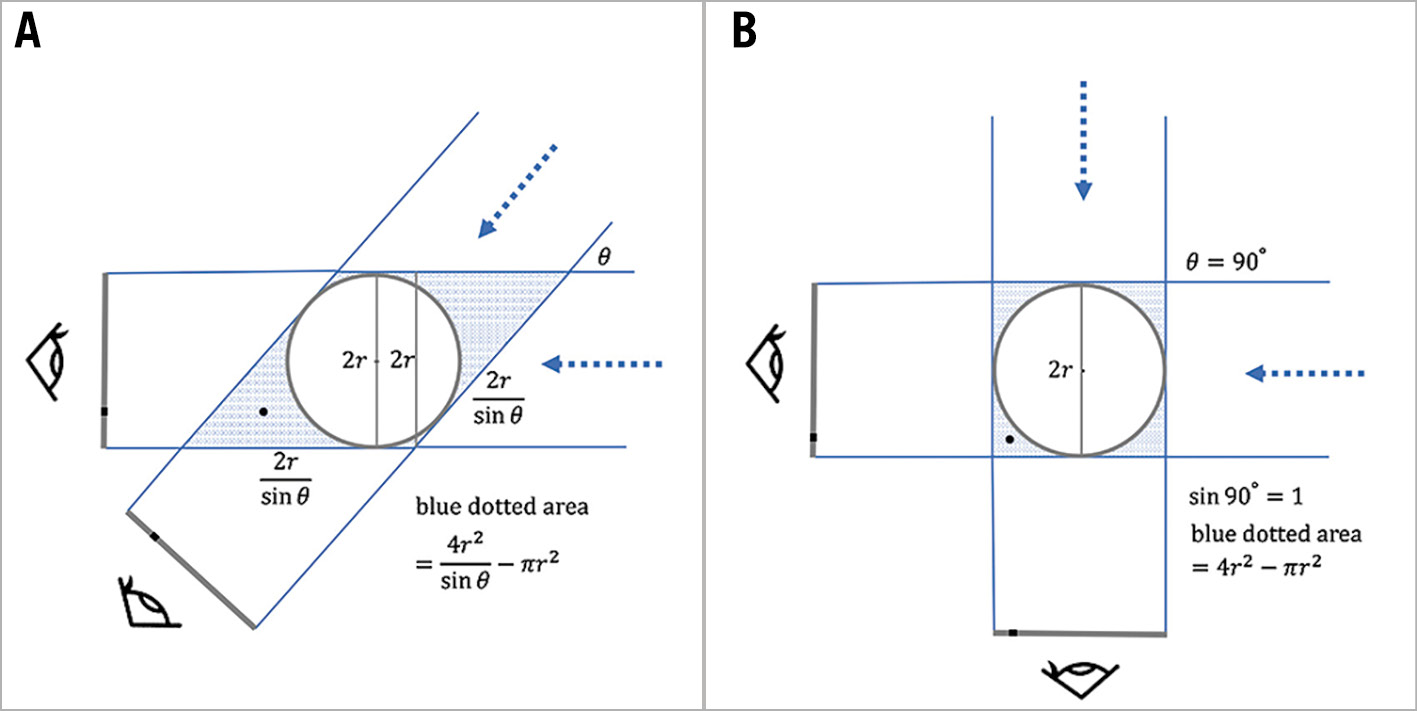
Figure 10. Dead angle with biplane fluoroscopy. A black circlet demonstrates a guidewire deviating outside the vessel. The blue dotted area demonstrates a dead angle of biplane fluoroscopy (A). It will be minimised when the fluoroscopic lines are orthogonal to each other (B).
Limitations
At present, this method remains theoretical and has not yet been tested in practice. Its efficacy should be evaluated in future research, taking into account the success rate of the procedure, the time required to perform it, the amount of dye and X-ray exposure, and the comfort level of the operators.
Conclusions
In this study, we present a simple approach for identifying optimal fluoroscopic angulations for CTO PCI utilising slab MIP images of CCTA and basic mathematical concepts, without specialised equipment or software. Specifically, we describe a process whereby a CTO segment can be vectorised, as outlined in the Central illustration. This approach has the potential to enhance the safety of CTO PCI by reducing dead angles in biplane fluoroscopy. Future research may be warranted to further investigate the effectiveness of this method.
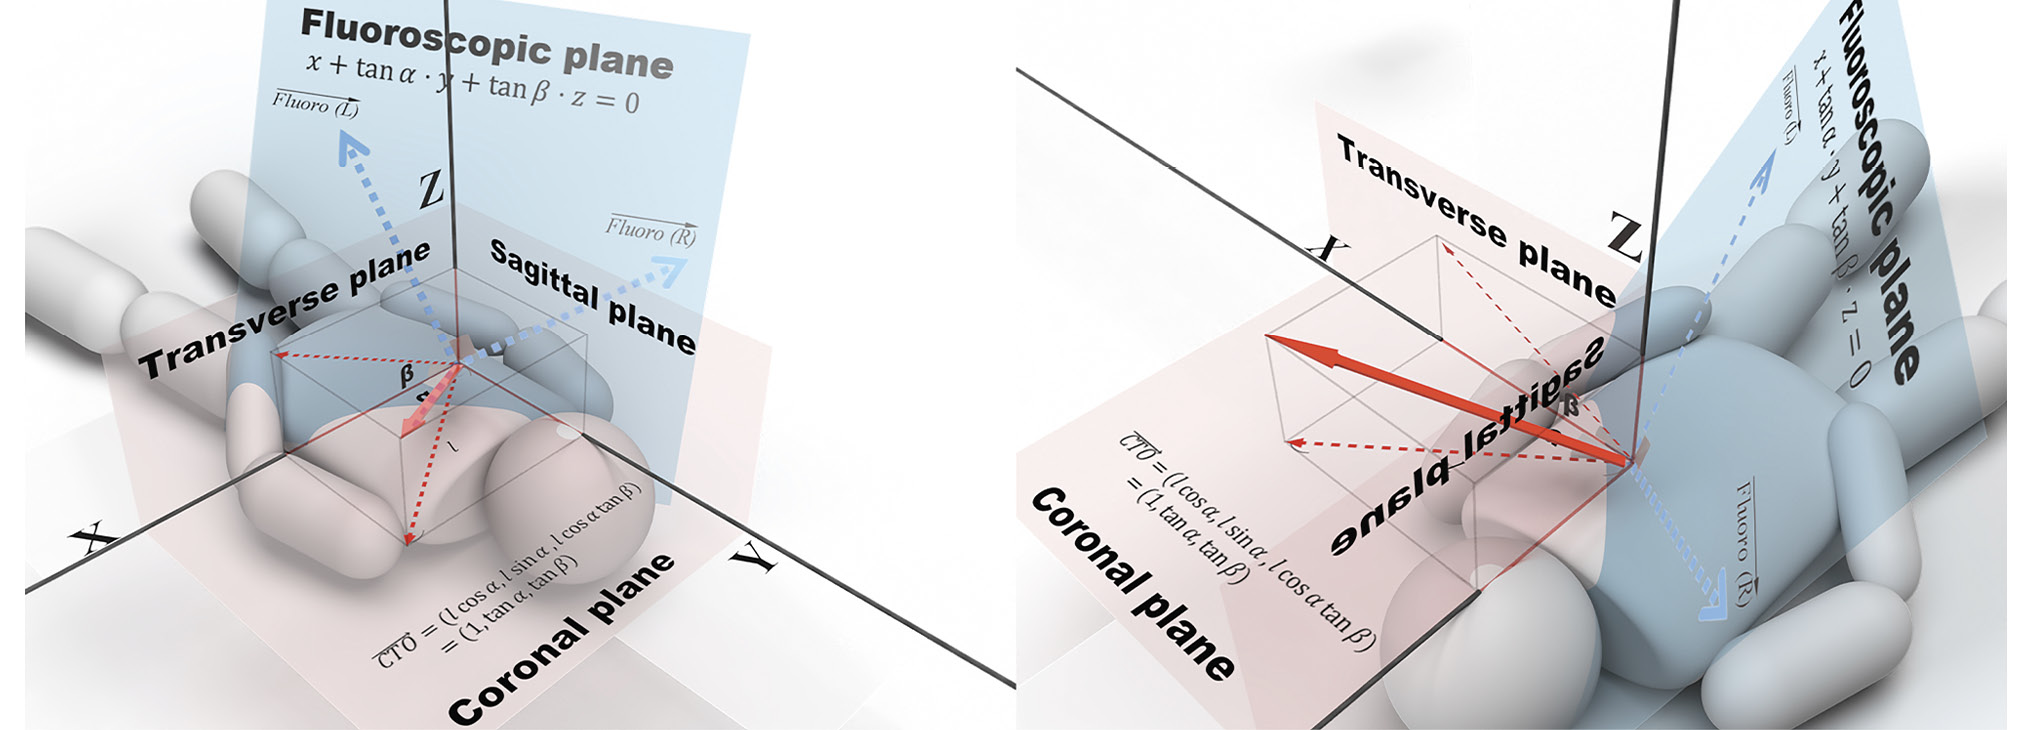
Central illustration. CTO vector, fluoroscopic plane and fluoroscopic vectors. Conceptual images at a glance. After vectorising a CTO segment using slab MIP images of CCTA and trigonometric functions, fluoroscopic vectors are calculated from the equation of a plane. They are finally translated into a combination of optimal fluoroscopic angulations. To allow readers to better understand, 2 different perspectives are shown. Note that the CTO vector and the 2 fluoroscopic vectors are orthogonal to each other. Fluoro (R): right fluoroscopic vector; Fluoro (L): left fluoroscopic vector. CCTA: coronary computed tomography angiography; CTO: chronic total occlusion; MIP: maximum intensity projection
Impact on daily practice
The proposed method detailed in this study provides precise fluoroscopic angulations that are based on the exact direction of a CTO segment, rather than relying on the subjective feelings or experiences of operators. Even if the calculated optimal angulations are not employed, operators can still appreciate the difference between the correct answer and what they observe.
Conflict of interest statement
The author has no conflicts of interest to declare.
